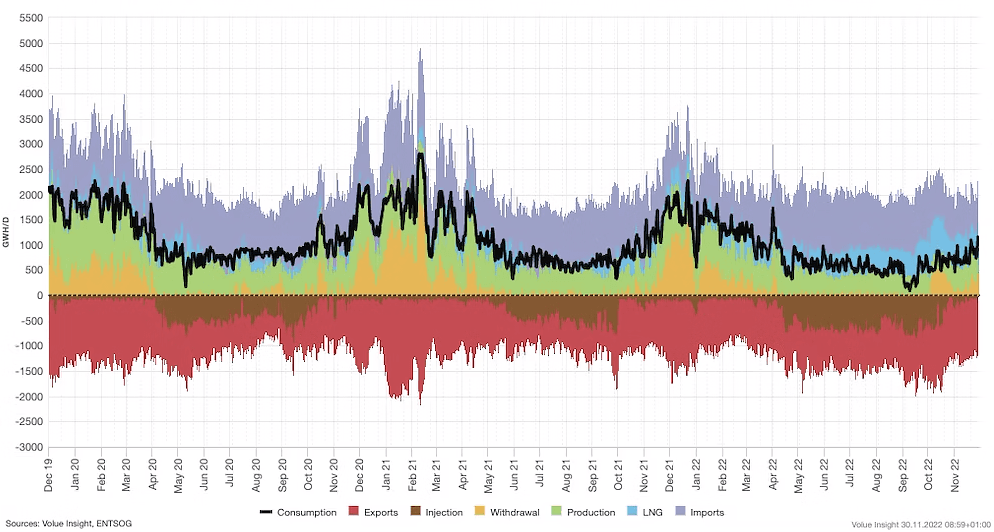
Our Gas Market analysis offers comprehensive data and insights for professionals in the energy sector, allowing them to make informed decisions in the dynamic and complex gas markets. We provide a range of technical data and forecasts related to gas consumption, supply, production, storage, and trading.
The gas product fundamentals covers consumption, pipeline and LNG supply, production, storage and cross-border flows. Forecasts are provided for consumption, non-EU pipeline supply, LNG supply and EU gas production. The forecast horizon is two years.
We provide closing prices, profiled forward curves, and price forecasts spanning 2 years ahead for the main European Hubs.
LNG send-out, capacity and inventory data are available back to 2014 for most countries in Europe, both on national level and for individual terminals.
Our product provides daily historical consumption data for each country, calculated using a precise formula. This formula takes into account imports, exports, withdrawals, injections, production, and LNG send-out. We also offer a breakdown of consumption into local distribution zones (LDZ) and the power sector, derived from our advanced Complete Forward stack optimization model.
NL Supply Demand Balance
We model non-EU gas supply to Europe from various sources, including Norway, Russia, Algeria, Azerbaijan, and Libya. Our forecasts incorporate outage reporting from Gassco, ensuring accuracy and reliability.
Access historical production data and our two-year ahead production forecasts, aggregated from ENTSOG. Stay ahead with insights into gas production trends.
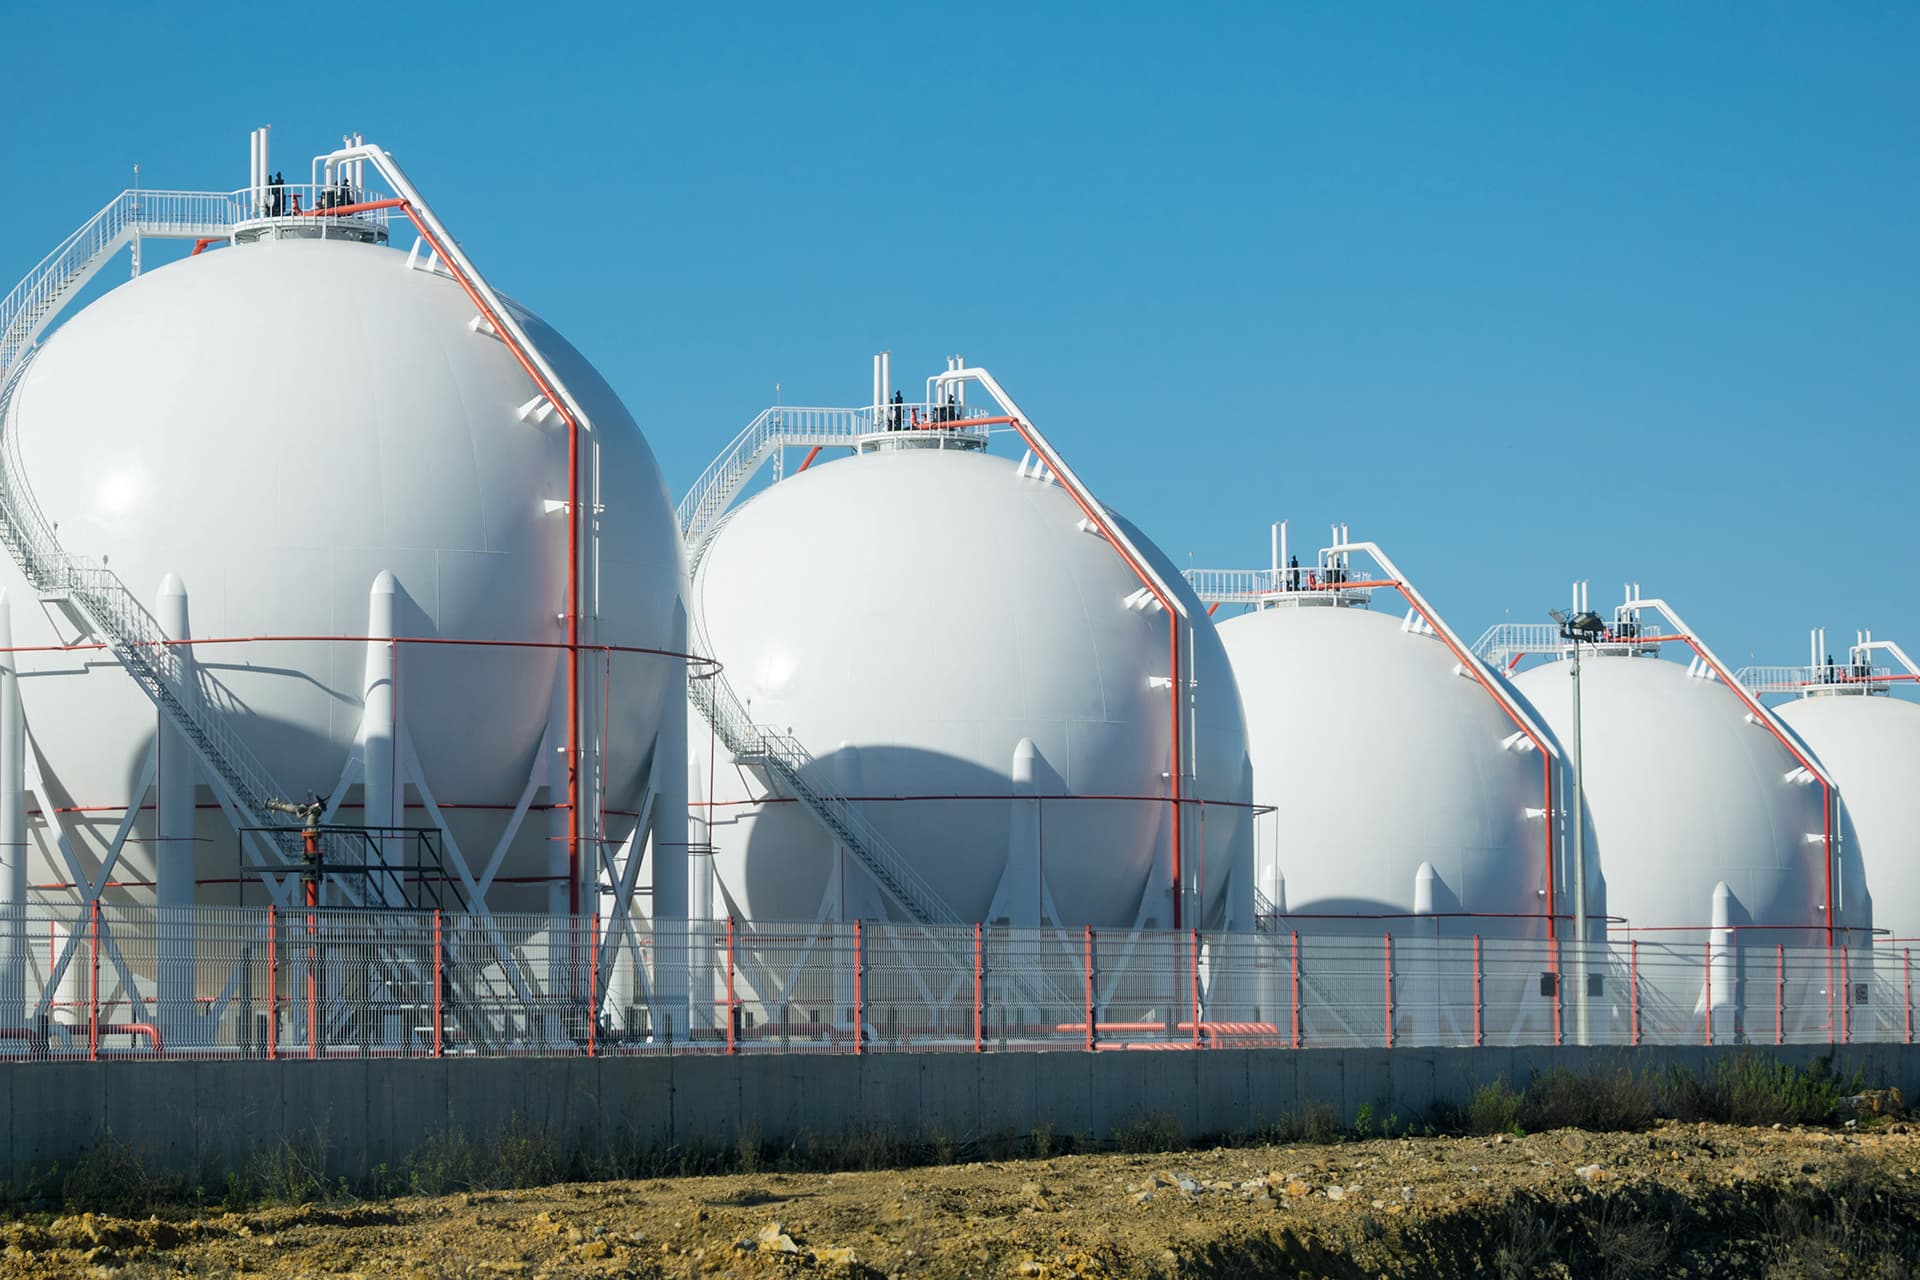
Our product includes comprehensive storage data, covering inventory, capacity, withdrawals, and injections at both the national and individual storage site levels. Historical data is sourced from GIE, and our forecasts extend two years into the future.
Get access to historical LNG send-out, capacity, and inventory data for most European countries and individual terminals. Our forecasts are driven by regression analysis, with a focus on the spread between European and Asian gas prices.
Historical cross-border pipeline flows and technical capacity data are available for individual interconnector points and aggregated to country-to-country levels. Data is sourced from ENTSOG, allowing for detailed analysis of gas flows.
We offer historical monthly data from the JODI database, covering demand, pipeline and LNG supply, and storage for a wide range of countries worldwide, enhancing your global market insights.
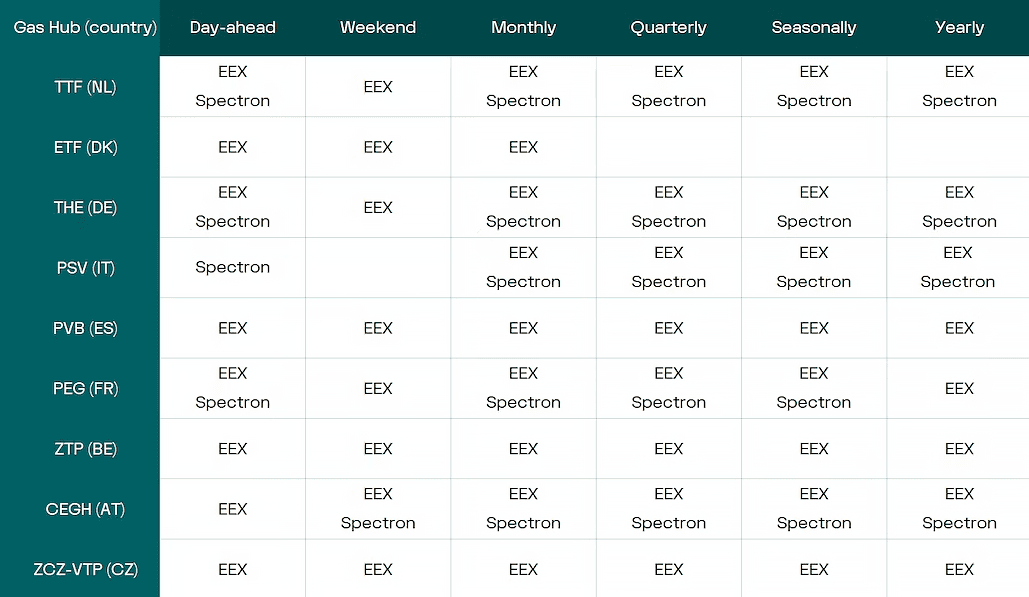
Stay up-to-date with daily closing prices from the main gas hubs in Europe. Data is sourced from reputable exchanges and brokers such as EEX and Spectron.
Contract Maturities
We provide profiled forward-curves for the covered hubs. Monthly profiled curves are made using seasonal profile generated from the most liquid hub prices (TTF). The seasonal profile is used to increase resolution of the longer term contracts, while keeping the average level over the delivery period. For certain markets, our monthly profile curves are extended beyond the last available traded contracts using the trend of the most liquid market as a reference (TTF). Monthly profiled curves should not be mistaken for actual prices; instead they are a helpful offering in order to compare hub prices with differences in liquidity and the number/size of traded products. The monthly profiled curves are also granulated further to daily resolution, taking into account possible weekend effects and the transition period between day ahead prices and the front month contract.
We provide two-year ahead price forecasts for the main gas hubs in Europe, both in real and delivered terms. Our forecasts are powered by a European-wide optimization model, utilizing consumption, supply, storage targets, and cross-border pipeline capacities.
Carsten Fock-Wenzel, Solution Sales Specialist